Linux and Python Environment Setup
Description: This is an "Hello world!" lab. In this lab, you will get hands on Python. You will learn Python development environment, data structures, basic syntax, functions, I/O. You will be asked to answer questions by programming. Download Lab1.pdf. Follow the instructions step by step.
Datasets: beatles-diskography.csv, 745090.csv
Scripts: hello.py, Demo_lab1.py, Lab_1_1.py, Lab_1_2.py
Reference: Learn Python the hard way. Google Python course, the first 4 lectures: Introduction, Strings, Lists, Dicts and Files.
Attention: print XX is deprecated in Python 3.2, please always use print(XX)
Software: Self install Python guide. Self install Spyder guide. Pre-compiled Python packages for Windows.
Description: "Crawl Data using API". In this lab, you will know what are REST APIs, how to use a typical REST API that requires authentication. Download Lab2.pdf. Follow the instructions step by step.
Scripts: twitter_stream_api.py, wordcount.py, twitter_data.txt.
Reference: Introduction to Python APIs, Twitter Stream API Documentation .
Other public data APIs: Free Weather Data, US Government Open Data , Space Science Data from NASA. Go to Resources page for more options.
Package needed: 'sudo pip install tweepy', 'sudo pip install requests'.
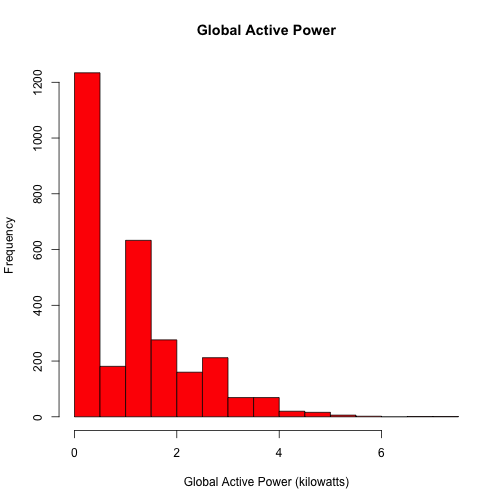
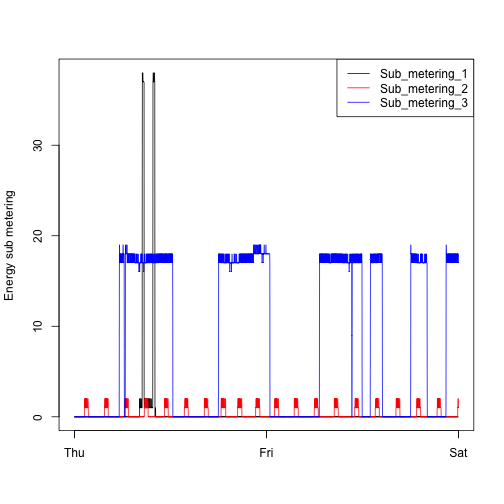
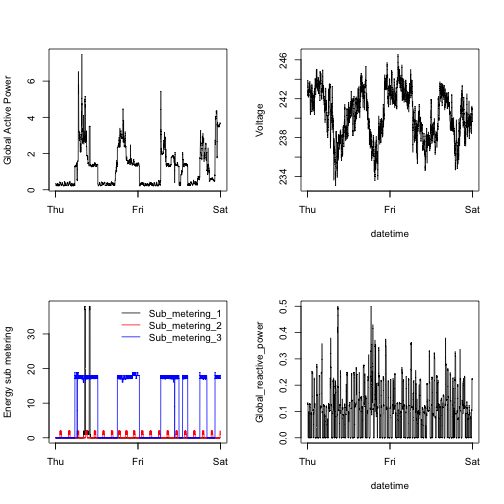
Description: "Data Visualization Basics". In this lab, you will learn how to draw bar plot, scatter plot, histogram, etc., with the Python matplotlib package. Interactive visualization with Tableau software, D3, plotly will come next week. Download Lab3.pdf. Follow the instructions step by step.
Scripts: demo_visualization.py, Lab_3_carmpg.py, Lab_3_electricpower.py
Dataset: household_power_consumption.zip
Figures: plot1.png, plot2.png, plot3.png, plot4.png
Reference: Matplotlib Visual Gallery, Pandas Documentation
Package needed: 'sudo pip install seaborn'
Description: "Data Visualization with Tableau". In this lab, you will learn how to draw bar plot, scatter plot, histogram, etc., with the Tableau Public software. Download Lab4.pdf. Follow the instructions step by step.
Dataset: Medals Won by Olympic Athletes
Reference: Getting Started with Tableau, Tableau Visual Gallery
Description: "Data Visualization with D3.js". In this lab, you will learn basics of D3.js, data binding with plots, word cloud plotting with D3.js. Download Lab5.pdf. Follow the instructions step by step.
Reference: D3.js Course on Udacity, D3 Visual Gallery with 2352 examples!, Tutorial by Scott Murray
Description: "K Nearest Neighbors". In this lab and the next lab, you will learn how to find the nearest neighbors of a data point, how to do hierarchical clustering, how to visualize clustering results with heatmap and how to do prediction with KNN algorithm. Download Lab6.pdf. Follow the instructions step by step.
Reference: Distance calculation, Hierarchical clustering documentation , Tutorial of hierarchical clustering
Dataset: historiacl_temperature_philly.csv
Script: matrix_generation.py
Description: "Clustering Algorithms". This lab is a continuation of Lab 6, you will learn how to do hierarchical clustering, k-means clustering, how to visualize clustering results with heatmap and how to measure the quantities of the clusters. Download Lab7.pdf. Follow the instructions step by step.
Reference: Hierarchical clustering documentation , Tutorial of hierarchical clustering, Matlab hierarchical clustering
Dataset: historiacl_temperature_philly.csv
Script: matrix_generation.py
Description: "Decision Tree and Bagging". In this lab, you will learn how to train a decisition tree classifier, test a classifier, avoid overfitting by early pruning and by bagging. Download Lab8.pdf. Follow the instructions step by step.
Reference: Well-known scikit-learn packages for Machine Learning, Decision Tree example
Dataset: UCI Car Data
Script: lab8_scripts.py
Description: "Using MongoDB". In this lab, you will learn the MongoDB basics, including data insertion, query, projection and index. You will also learn simple analysis with MongoDB. Download Lab9.pdf. Follow the instructions step by step. The lecture slides of MongoDB can be downloaded from here to help you learn.
Reference: MongoDB documentation, PyMongo documentation
Dataset: Large twitter.json file
Script: lab9_scripts.py
Description: "WEKA Machine Learning Software". In this lab, you will learn the WEKA Machine Learning Software, including data loading, visualization, classification with the software. Download Lab10.pdf. Follow the instructions step by step.